Nike, a giant sportswear and accessories brand, has consistently maintained its position as the leading player in the industry. This article delves into Nike’s revenue, growth, profit, number of employees, and more.
Table of Contents
Key Nike Stats:
- In 2023, NIKE, Inc. achieved record Revenues of $51.217 billion, which is a 469.4% increase since 2000.
- Nike returned $7.5 billion to their shareholders in 2023 through share repurchases and dividends
- Nike’s gross profit in 2023 was $22.292 billion, up from $8.498 billion in 2010, showcasing a consistent rise over the years.
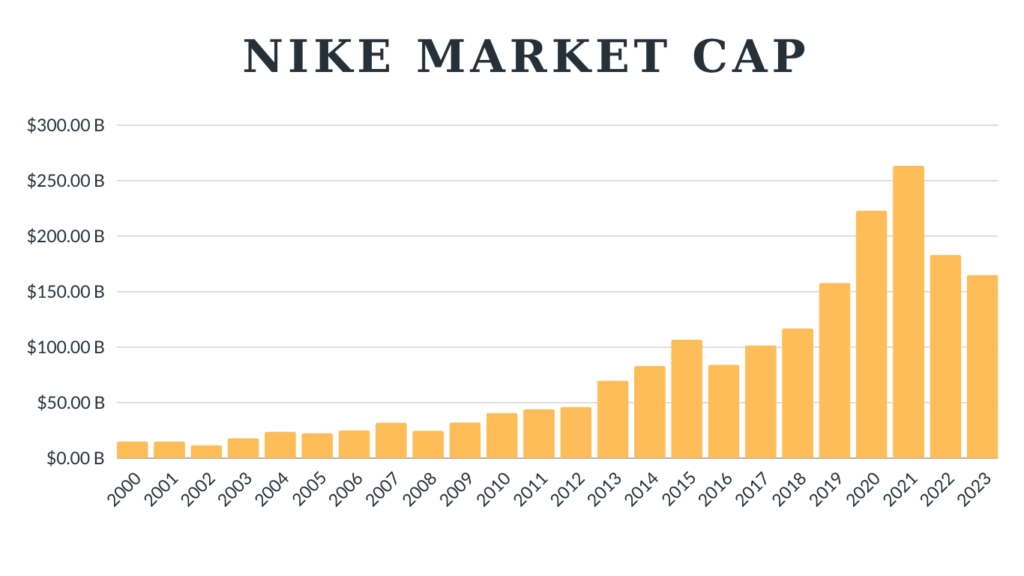
- Nike’s market cap peaked at $263.55 billion in 2021 but saw a decline to $165.23 billion in 2023.
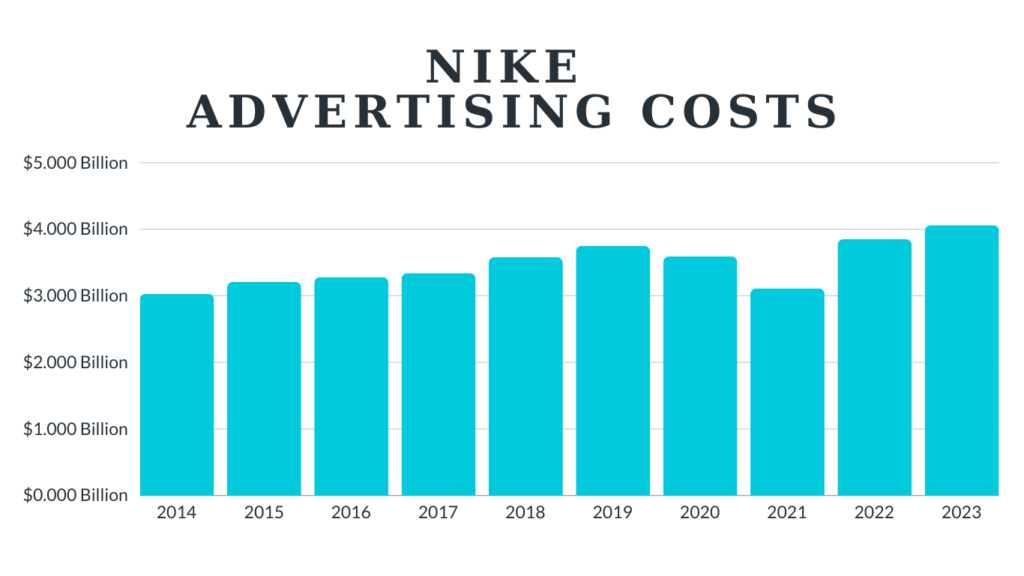
- Nike spent $4.06 billion on advertising in 2023, the highest in its history and a 34% increase from $3.03 billion in 2014.
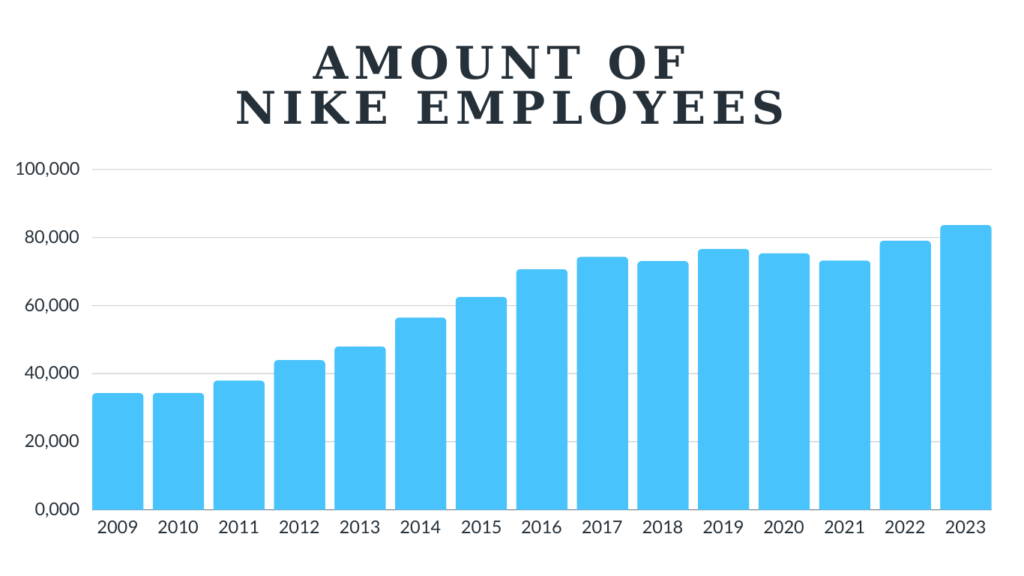
- The number of employees at Nike has grown significantly, reaching 83,700 in 2023, a 144% increase from 34,400 employees in 2010.
Nike Overview
| KEY STAT | INFO STAT |
|---|---|
| Founders | Bill Bowerman, Phil Knight |
| Founded | January 25, 1964 (as Blue Ribbon Sports), May 30, 1971 (as Nike) |
| Headquarters | Beaverton, Oregon, USA |
| Owner | Nike, Inc. |
| CEO (current) | John Donahoe |
| Industry | Sportswear, Apparel and Equipment |
| Revenue | $51.217 Billion (2023) |
| Employees | 83,700 employees (2023) |
| Website | nike.com |
| Service Area | Worldwide |
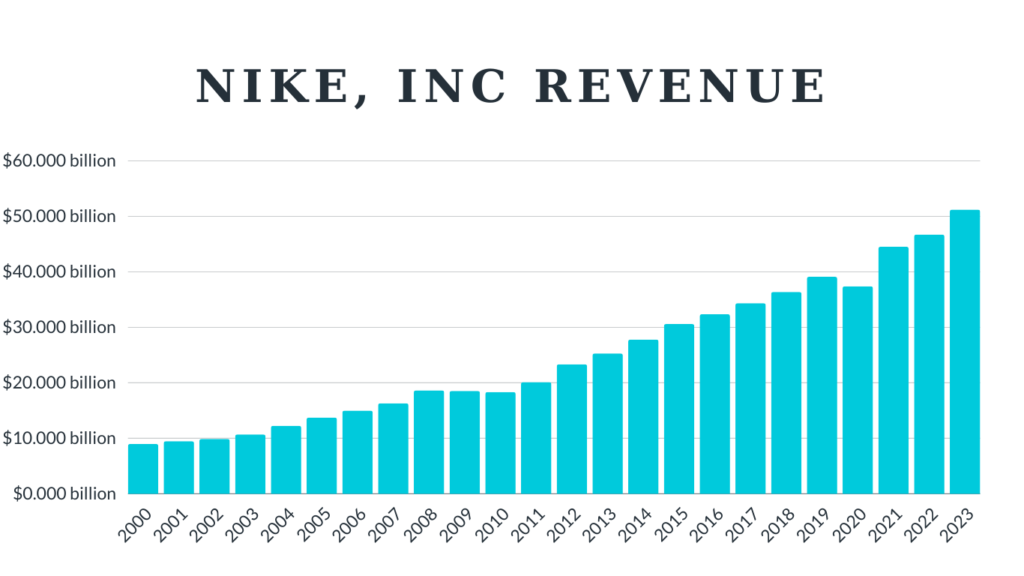
Nike, Inc Revenue
In 2023, Nike, Inc. reported a revenue of $51.217 billion, up from $8.995 billion in 2000, marking a growth of approximately 469.4% over 23 years. This is the highest revenue recorded for the company, showcasing its strong market position and global presence.
Nike Inc includes Converse in their revenue so if you want only the revenue from the Nike brand go to the next section.
| Year | Revenue |
|---|---|
| 2023 | $51.217 billion |
| 2022 | $46.710 billion |
| 2021 | $44.538 billion |
| 2020 | $37.403 billion |
| 2019 | $39.117 billion |
| 2018 | $36.397 billion |
| 2017 | $34.350 billion |
| 2016 | $32.376 billion |
| 2015 | $30.601 billion |
| 2014 | $27.799 billion |
| 2013 | $25.313 billion |
| 2012 | $23.331 billion |
| 2011 | $20.117 billion |
| 2010 | $18.324 billion |
| 2009 | $18.528 billion |
| 2008 | $18.627 billion |
| 2007 | $16.326 billion |
| 2006 | $14.995 billion |
| 2005 | $13.740 billion |
| 2004 | $12.253 billion |
| 2003 | $10.697 billion |
| 2002 | $9.893 billion |
| 2001 | $9.489 billion |
| 2000 | $8.995 billion |
Source: Statista And Nike Financial Reports 2004
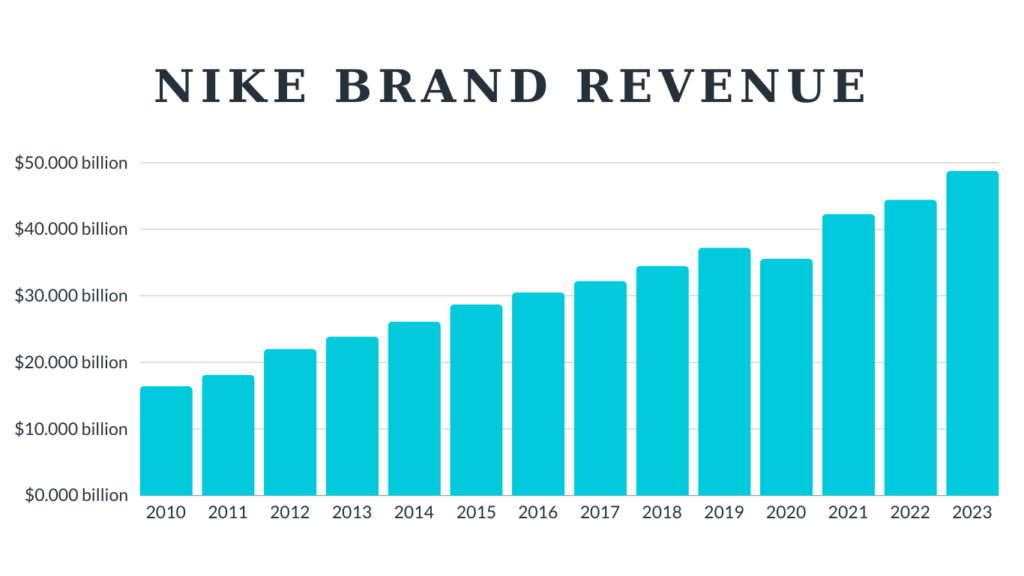
Nike Brand Revenue
In 2023, Nike’s Brand revenue was $48.763 billion, up from $16.443 billion in 2010, marking a significant growth of 196.6% over 13 years.
Nike’s revenue of $48.763 billion in 2023 more than doubled Adidas’ revenue of $23.190 billion the same year.
| Year | NIKE Brand Revenue |
|---|---|
| 2023 | $48.763 billion |
| 2022 | $44.436 billion |
| 2021 | $42.293 billion |
| 2020 | $35.568 billion |
| 2019 | $37.218 billion |
| 2018 | $34.485 billion |
| 2017 | $32.233 billion |
| 2016 | $30.507 billion |
| 2015 | $28.701 billion |
| 2014 | $26.112 billion |
| 2013 | $23.881 billion |
| 2012 | $22.011 billion |
| 2011 | $18.145 billion |
| 2010 | $16.443 billion |
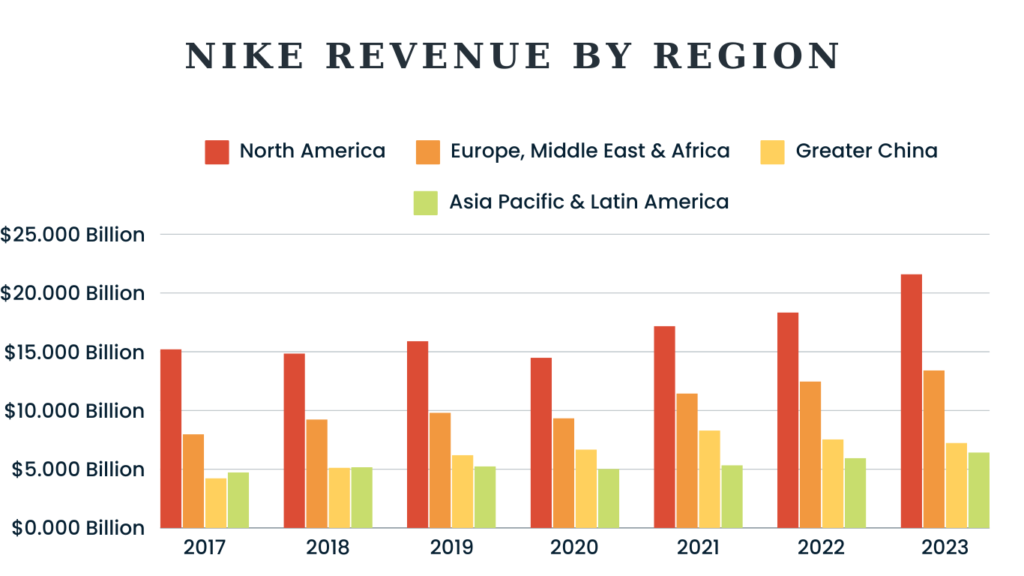
Nike Revenue By Region
In 2023, North America led Nike’s regional revenues with $21.608 billion, followed by Europe, Middle East & Africa (EMEA) at $13.418 billion. Greater China showed the highest percentage increase among regions, contributing $7.248 billion, and had significant growth of 71% from 2017.
Additionally, Asia Pacific & Latin America generated $6.431 billion, with the Global Brand Divisions adding $58 million to the total revenue.
Global Brand Division revenues include NIKE Brand licensing and other miscellaneous revenues that are not part of a geographic operating segment
| Year | North America | Europe, Middle East & Africa | Greater China | Asia Pacific & Latin America | Global brand divisions |
|---|---|---|---|---|---|
| 2023 | $21.608 Billion | $13.418 Billion | $7.248 Billion | $6.431 Billion | $58 Million |
| 2022 | $18.353 Billion | $12.479 Billion | $7.547 Billion | $5.955 Billion | $102 Million |
| 2021 | $17.189 Billion | $11.456 Billion | $8.29 Billion | $5.343 Billion | $25 Million |
| 2020 | $14.484 Billion | $9.347 Billion | $6.679 Billion | $5.028 Billion | $30 Million |
| 2019 | $15.902 Billion | $9.812 Billion | $6.208 Billion | $5.254 Billion | $42 Million |
| 2018 | $14.855 Billion | $9.242 Billion | $5.134 Billion | $5.166 Billion | $88 Million |
| 2017 | $15.216 Billion | $7.97 Billion | $4.237 Billion | $4.737 Billion | $73 Million |
Source: Statista
Nike Revenue By Division
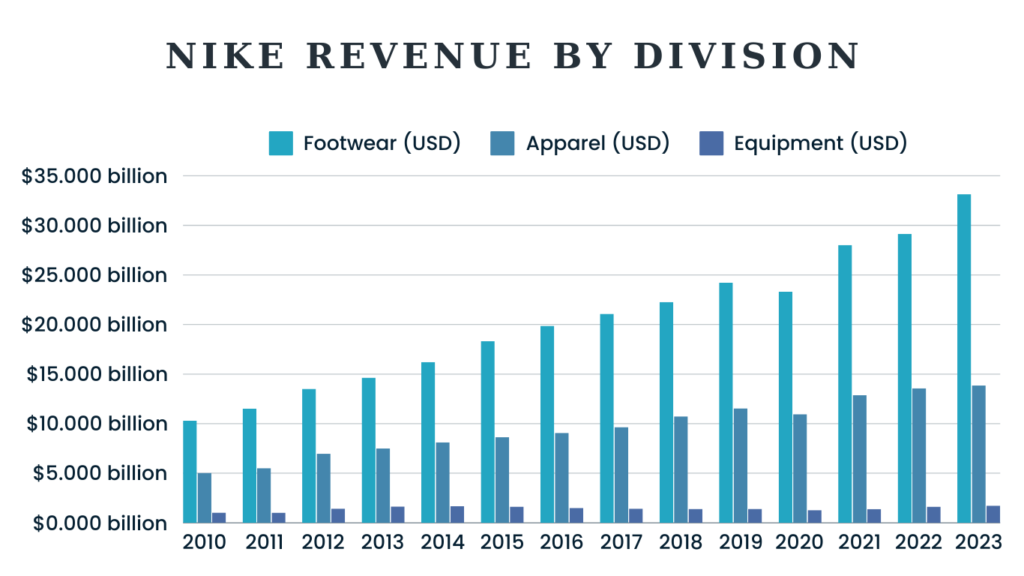
Nike’s footwear segment has been its most lucrative product category, consistently outshining both apparel and equipment segments in terms of revenue.
In 2023, Nike’s footwear sales soared to an impressive $33.135 billion globally. This figure significantly surpassed the revenue of the apparel segment, which stood at $13.843 billion, and the equipment segment, totaling $1.727 billion. Meanwhile, the Global Brand Division only contributed $58 million to Nike’s overall revenue.
| Year | Footwear (USD) | Apparel (USD) | Equipment (USD) | Global Brand Division (USD) |
|---|---|---|---|---|
| 2023 | $33.135 billion | $13.843 billion | $1.727 billion | $58 million |
| 2022 | $29.143 billion | $13.567 billion | $1.624 billion | $102 million |
| 2021 | $28.021 billion | $12.865 billion | $1.382 billion | $25 million |
| 2020 | $23.305 billion | $10.953 billion | $1.280 billion | $30 million |
| 2019 | $24.222 billion | $11.550 billion | $1.404 billion | $42 million |
| 2018 | $22.268 billion | $10.733 billion | $1.396 billion | $88 million |
| 2017 | $21.081 billion | $9.654 billion | $1.425 billion | $73 million |
| 2016 | $19.871 billion | $9.067 billion | $1.496 billion | $73 million |
| 2015 | $18.318 billion | $8.637 billion | $1.631 billion | $115 million |
| 2014 | $16.208 billion | $8.109 billion | $1.670 billion | $125 million |
| 2013 | $14.635 billion | $7.491 billion | $1.640 billion | $115 million |
| 2012 | $13.513 billion | $6.958 billion | $1.429 billion | $111 million |
| 2011 | $11.518 billion | $5.513 billion | $1.018 billion | $96 million |
| 2010 | $10.301 billion | $5.026 billion | $1.030 billion | $86 million |
Nike Gross Profit
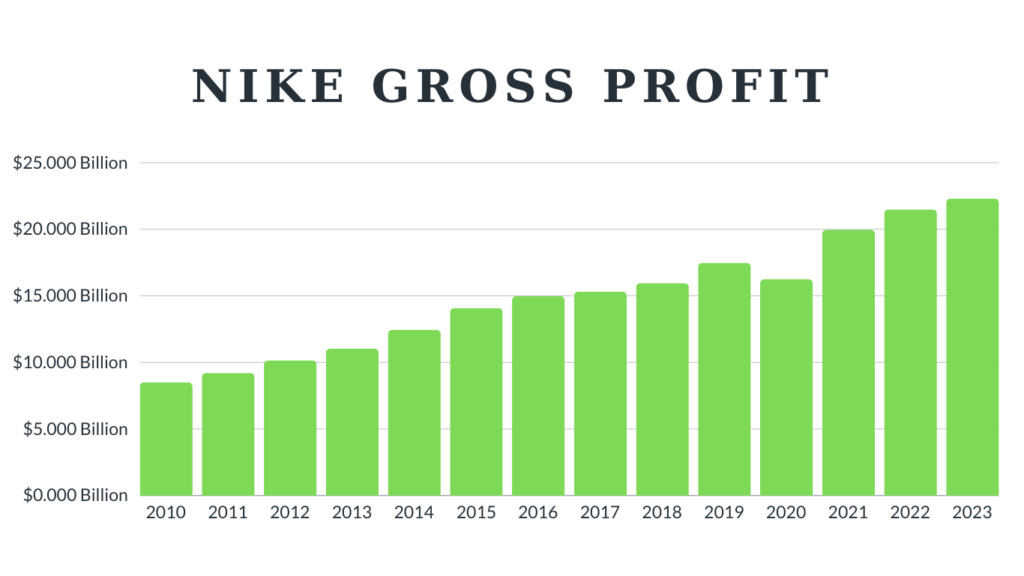
In 2023, Nike achieved a gross profit of $22.292 Billion, a 162.3% increase from $8.498 Billion in 2010 and only a 3.8% increase compared to the previous year. Nike had a 43.5 % gross profit margin in 2023 and has stayed within 2% of this profit margin since 2014 with a peak of 46.2%
| Year | Gross Profit |
|---|---|
| 2023 | $22.292 Billion |
| 2022 | $21.479 Billion |
| 2021 | $19.962 Billion |
| 2020 | $16.241 Billion |
| 2019 | $17.474 Billion |
| 2018 | $15.956 Billion |
| 2017 | $15.312 Billion |
| 2016 | $14.971 Billion |
| 2015 | $14.067 Billion |
| 2014 | $12.446 Billion |
| 2013 | $11.034 Billion |
| 2012 | $10.148 Billion |
| 2011 | $9.202 Billion |
| 2010 | $8.498 Billion |
Source: Statista(2023-2014) & Ten year report(2013-2010)
Nike Net Income
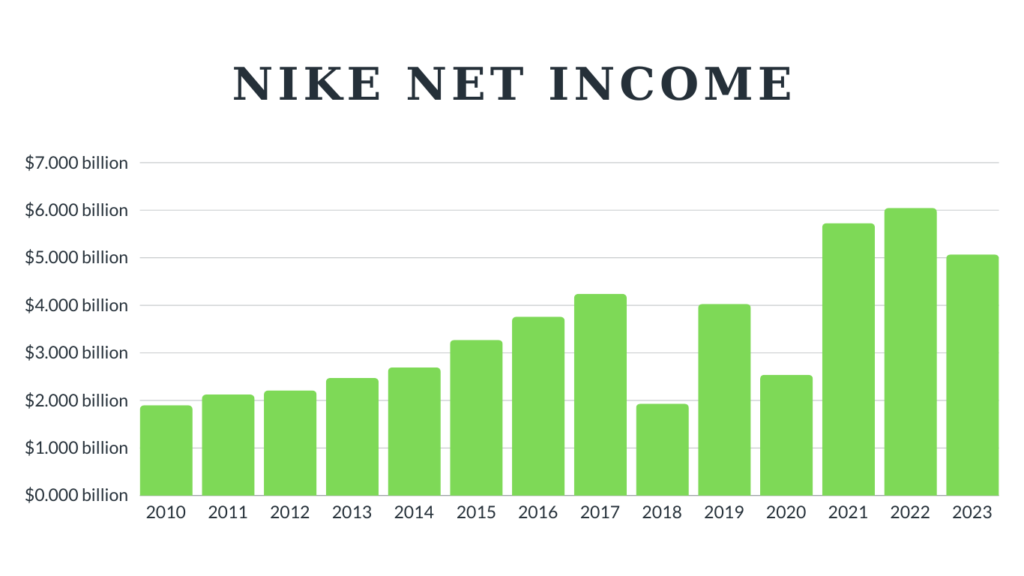
These values represent the final profit or loss of the company after all expenses, including taxes and interest, have been deducted from the company’s revenue.
In 2023, Nike had a Net Income of $5.070 billion, a decrease of 16.14% compared to the previous year. Even with this decrease, Nike has had a 166.8% increase in net income since 2010.
| Year | Net Income |
|---|---|
| 2023 | $5.070 billion |
| 2022 | $6.046 billion |
| 2021 | $5.727 billion |
| 2020 | $2.539 billion |
| 2019 | $4.029 billion |
| 2018 | $1.933 billion |
| 2017 | $4.240 billion |
| 2016 | $3.760 billion |
| 2015 | $3.273 billion |
| 2014 | $2.693 billion |
| 2013 | $2.472 billion |
| 2012 | $2.211 billion |
| 2011 | $2.124 billion |
| 2010 | $1.900 billion |
Source: Nike Annual Reports
Nike And Adidas Brand Value
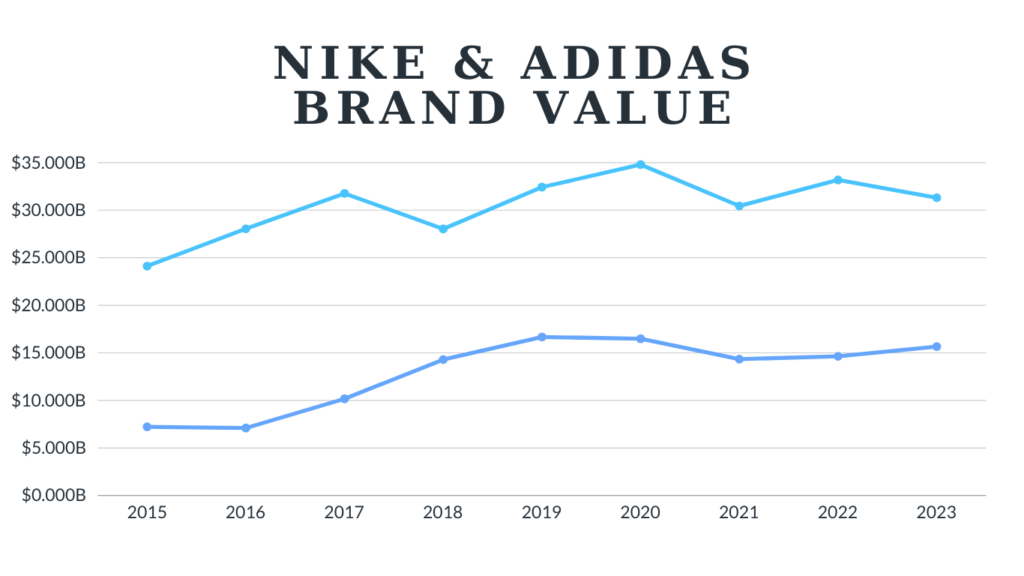
Adidas has had a higher increase of 117% from $7.224 billion in 2015 to $15.660B in 2023, while Nike only had a 30% increase since 2015. But even with Adidas having had a big increase in brand value Nike’s brand value is still 2 times larger than Adidas(1.9992 times larger to be exact).
| Year | NIKE | ADIDAS |
|---|---|---|
| 2023 | $31.307B | $15.660B |
| 2022 | $33.176B | $14.636B |
| 2021 | $30.443B | $14.342B |
| 2020 | $34.792B | $16.481B |
| 2019 | $32.421B | $16.669B |
| 2018 | $28.030B | $14.295B |
| 2017 | $31.762B | $10.169B |
| 2016 | $28.041B | $7.098B |
| 2015 | $24.118B | $7.224B |
Source: Brandirectory
Nike Market Cap
Nike’s market capitalization has experienced big fluctuations over the years, reflecting both the company’s growth and market dynamics. In 2021, Nike reached its peak market cap of $263.55 billion, showcasing a significant milestone in the company’s valuation. However, by 2024, Nike’s market cap had decreased to $109.89 billion, representing a decline of around 58.3% from its all-time high in 2021.
Despite this recent decrease, Nike’s market cap growth over the long term remains impressive. From 2000 to 2024, Nike’s market cap increased from $15.05 billion to $109.89 billion, a staggering growth of around 630%
| Year | Market Cap (USD) |
|---|---|
| 2024(17th July) | $109.89 B |
| 2023 | $165.23 B |
| 2022 | $183.07 B |
| 2021 | $263.55 B |
| 2020 | $223.02 B |
| 2019 | $157.94 B |
| 2018 | $116.91 B |
| 2017 | $101.58 B |
| 2016 | $84.17 B |
| 2015 | $106.68 B |
| 2014 | $83.07 B |
| 2013 | $69.83 B |
| 2012 | $46.21 B |
| 2011 | $44.22 B |
| 2010 | $40.87 B |
| 2009 | $32.20 B |
| 2008 | $24.68 B |
| 2007 | $31.94 B |
| 2006 | $24.95 B |
| 2005 | $22.50 B |
| 2004 | $23.94 B |
| 2003 | $18.01 B |
| 2002 | $11.76 B |
| 2001 | $15.07 B |
| 2000 | $15.05 B |
Source: CompaniesMarketCap
How Much Does Nike Spend on Advertising?
Nike’s advertising expenditures have consistently reflected the company’s commitment to maintaining its brand presence and market dominance. In 2023, Nike spent $4.06 billion on advertising. This represents a significant increase of around 34% from the $3.03 billion spent in 2014.
Over the years, Nike’s advertising costs have shown a general upward trend, with notable fluctuations. For instance, in 2021, Nike’s advertising expenses were $3.11 billion, which then surged to $3.85 billion in 2022. This nearly 24% increase from 2021 to 2022 shows Nike’s big investments in marketing to bolster its brand image and consumer engagement.
| Year | Advertising costs |
|---|---|
| 2023 | $4.06 Billion |
| 2022 | $3.85 Billion |
| 2021 | $3.11 Billion |
| 2020 | $3.59 Billion |
| 2019 | $3.75 Billion |
| 2018 | $3.58 Billion |
| 2017 | $3.34 Billion |
| 2016 | $3.28 Billion |
| 2015 | $3.21 Billion |
| 2014 | $3.03 Billion |
Source: Statista
Amount of Nike Employees
Nike’s workforce has grown by a lot over the years, showing how the company is expanding and increasing their global presence.
In 2023, Nike employed 83,700 people, a significant rise from the 34,300 employees in 2009. This growth represents an increase of nearly 144% over 14 years.
The increase in the number of employees has been particularly pronounced in recent years. For instance, between 2021 and 2023, Nike’s workforce grew by 14%, from 73,300 to 83,700 employees. This period of growth highlights Nike’s ongoing efforts to scale its operations and support its expanding market reach.
| Year | Number of Employees |
|---|---|
| 2023 | 83,700 |
| 2022 | 79,100 |
| 2021 | 73,300 |
| 2020 | 75,400 |
| 2019 | 76,700 |
| 2018 | 73,100 |
| 2017 | 74,400 |
| 2016 | 70,700 |
| 2015 | 62,600 |
| 2014 | 56,500 |
| 2013 | 48,000 |
| 2012 | 44,000 |
| 2011 | 38,000 |
| 2010 | 34,400 |
| 2009 | 34,300 |
Source: Statista
Amount Of Nike Retail Stores Worldwide
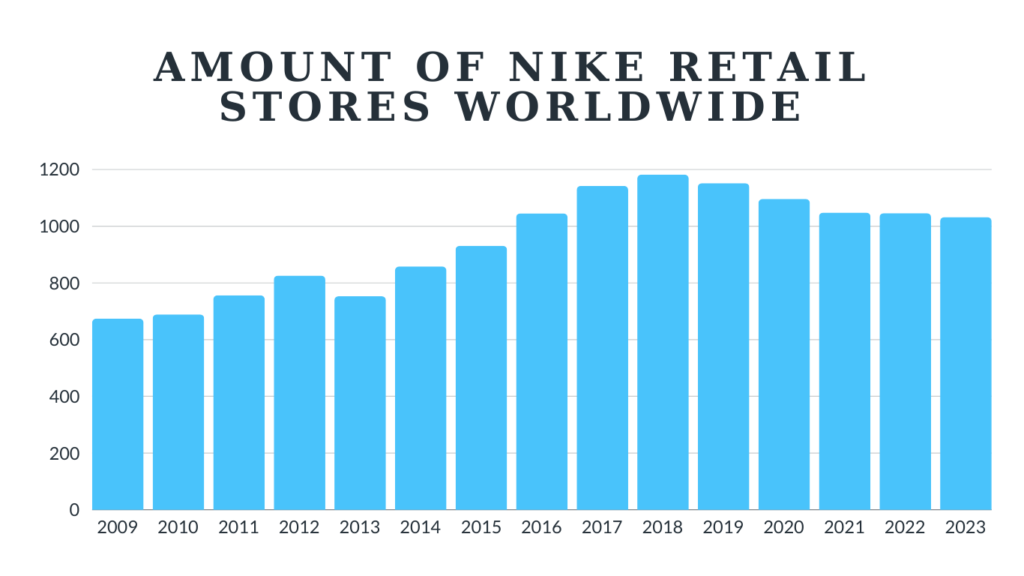
Nike has also seen notable growth in its retail presence over the years. As of 2023, Nike operates 1,032 retail stores worldwide, a significant increase from the 674 stores it had in 2009. This increase of over 53% shows that Nike wants to improve its direct-to-consumer sales and strengthen its global footprint.
The number of retail stores peaked in 2018 at 1,182, after which there was a slight decline, likely due to a restructuring or because of the COVID-19 pandemic. Despite this, Nike continues to maintain a strong retail presence, with over 1,000 stores worldwide in recent years.
| Year | Number of Retail Stores |
|---|---|
| 2023 | 1,032 |
| 2022 | 1,046 |
| 2021 | 1,048 |
| 2020 | 1,096 |
| 2019 | 1,152 |
| 2018 | 1,182 |
| 2017 | 1,142 |
| 2016 | 1,045 |
| 2015 | 931 |
| 2014 | 858 |
| 2013 | 753 |
| 2012 | 826 |
| 2011 | 756 |
| 2010 | 689 |
| 2009 | 674 |
All Graphs In Downloadable Images
You can use any of these images as long as you give credit👍.
.

