Adidas, a globally renowned sportswear and accessories brand, has consistently maintained its position as a leading player in the industry. This article delves into Adidas’ revenue, growth, profit, number of employees and more.
Table of Contents
Key Adidas Stats
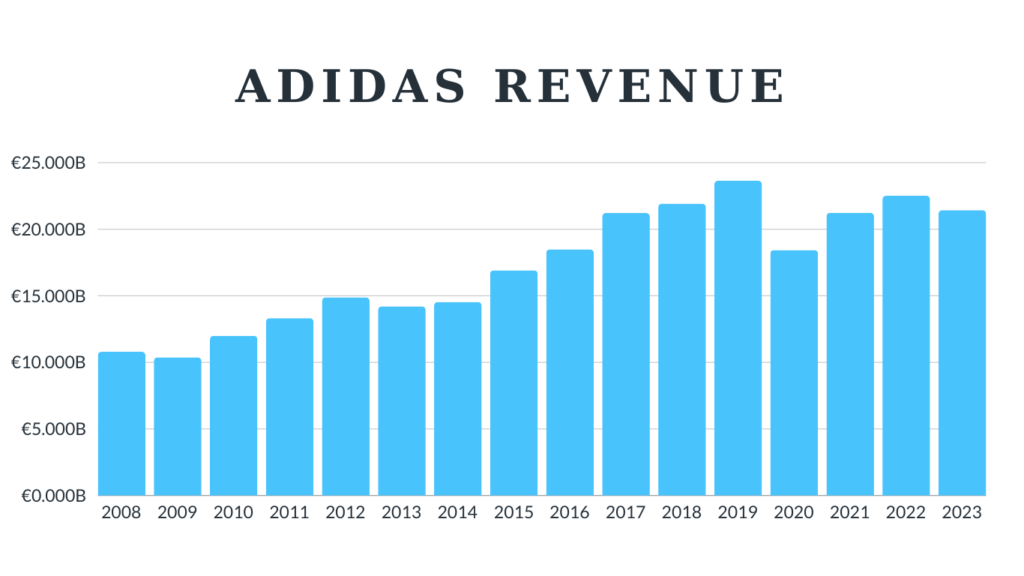
- Revenue Growth: Adidas’ revenue increased by approximately 98% from €10.799 billion in 2008 to €21.427 billion in 2023.
- Regional Performance: The EMEA region remains the top revenue generator, contributing €8.235 billion in 2023.
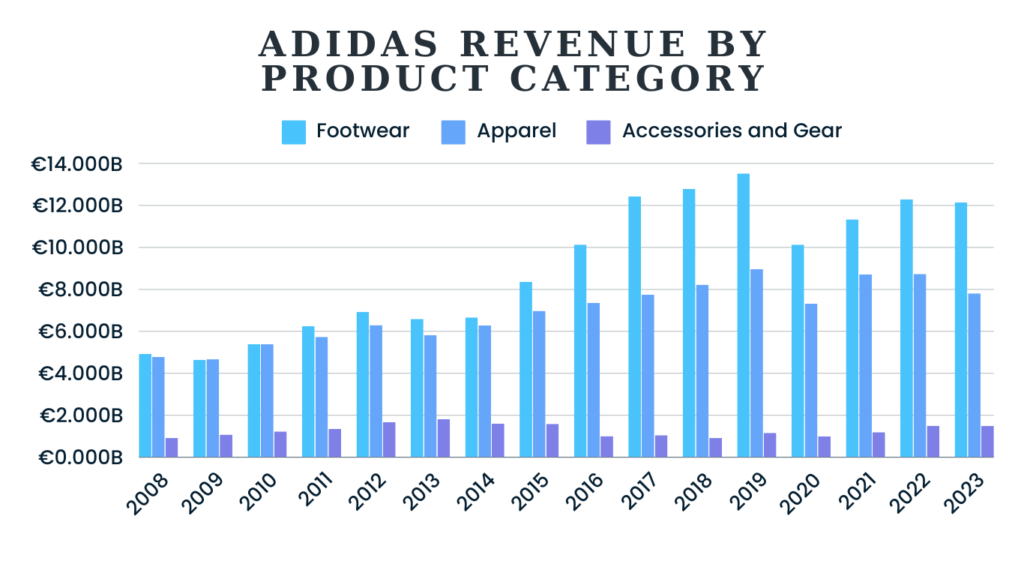
- Product Category: Footwear is the leading product category, with sales reaching €12.139 billion in 2023, a 147% increase from 2008.
- Brand Value: In 2023, Adidas’ brand value was $15.660 billion, a 115% increase from $7.284 billion in 2008.
- Employee Compensation: The average salary per Adidas employee increased by 53% from €32,866 in 2008 to €50,165 in 2023.
Adidas Overview
| KEY STAT | INFO STAT |
|---|---|
| Founders | Adolf Dassler |
| Founded | 18 August 1949 |
| Headquarters | Herzogenaurach, Germany |
| Owner | Adidas AG |
| CEO (current) | Bjørn Gulden |
| Service(s) | Manufacturing and selling sports apparel, footwear, and accessories |
| Revenue | €21.427 Billion (2023) |
| Employees | 59,030 employees (2023) |
| Website | adidas.com |
| Service Area | Worldwide |
Adidas Revenue/Net Sales
In 2023, Adidas generated a revenue of €21.427 billion ($23.190 billion), reflecting a significant presence in the global sportswear market. Compared to €10.799 Billion in 2008, this marks a growth of approximately 98.42% over 14 years and the highest revenue was recorded in 2019 at €23.640 billion ($26.477 billion) €2.213 Billion less than in 2023.
Net Sales and Revenue are not the same thing but Adidas seems to use them interchangeably and Macrotrends also called their “net sales” as revenue.
| Year | Revenue in Euro | Revenue in USD |
|---|---|---|
| 2023 | €21.427 Billion | $23.190 Billion |
| 2022 | €22.511 Billion | $23.718 Billion |
| 2021 | €21.234 Billion | $25.122 Billion |
| 2020 | €18.435 Billion | $22.668 Billion |
| 2019 | €23.640 Billion | $26.477 Billion |
| 2018 | €21.915 Billion | $25.882 Billion |
| 2017 | €21.218 Billion | $23.983 Billion |
| 2016 | €18.483 Billion | $21.347 Billion |
| 2015 | €16.915 Billion | $18.782 Billion |
| 2014 | €14.534 Billion | $19.320 Billion |
| 2013 | €14.203 Billion | $19.250 Billion |
| 2012 | €14.883 Billion | $19.141 Billion |
| 2011 | €13.322 Billion | $18.586 Billion |
| 2010 | €11.990 Billion | $15.923 Billion |
| 2009 | €10.381 Billion | $14.481 Billion |
| 2008 | €10.799 Billion |
Source: USD Values From Macrotrends (2009-2023) Euro Values from Adidas Annual Reports
Adidas Revenue by Region
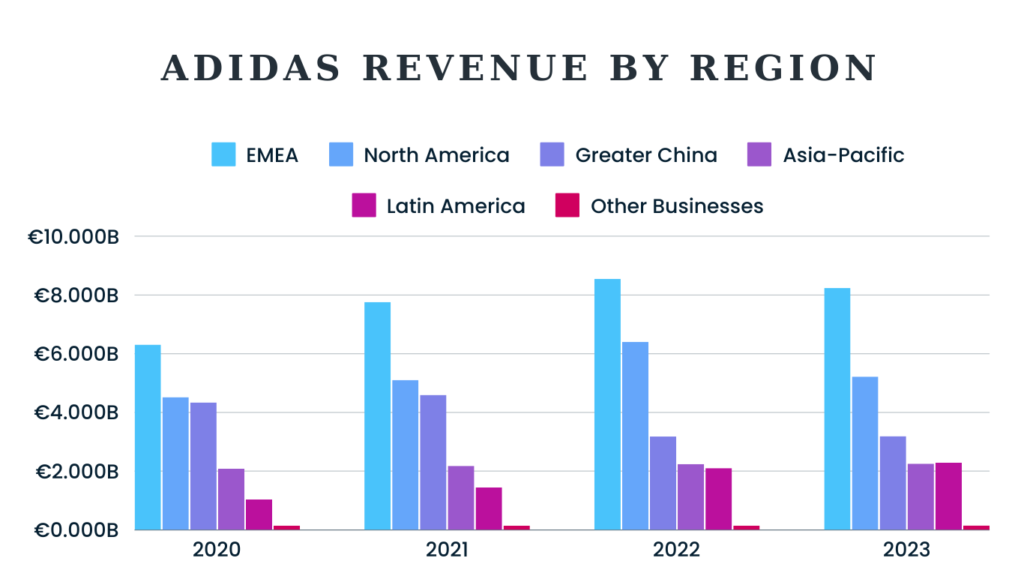
In 2023, the EMEA region led Adidas’ revenue contributions with €8.235 billion, a 30% increase from €6.308 billion in 2020. North America followed at €5.219 billion, and Greater China contributed €3.190 billion. The Asia-Pacific region generated €2.254 billion, while Latin America produced €2.291 billion. Other businesses added €155 million to the total revenue.
| Year | EMEA | North America | Greater China | Asia-Pacific | Latin America | Other Buisnesses |
|---|---|---|---|---|---|---|
| 2023 | €8.235 Billion | €5.219 Billion | €3.190 Billion | €2.254 Billion | €2.291 Billion | €155 Million |
| 2022 | €8.55 Billion | €6.404 Billion | €3.179 Billion | €2.241 Billion | €2.104 Billion | €150 Million |
| 2021 | €7.76 Billion | €5.105 Billion | €4.597 Billion | €2.180 Billion | €1.446 Billion | €145 Million |
| 2020 | €6.308 Billion | €4.519 Billion | €4.342 Billion | €2.083 Billion | €1.035 Billion | €149 Million |
Source: Adidas Annual Reports
Adidas Revenue By Product Category
Footwear remained Adidas’ top product category in 2023, generating €12.139 billion, a 147% increase from €4.919 billion in 2008. Apparel followed with €7.806 billion, and accessories and gear contributed €1.483 billion, showing substantial growth in Footwear and Apparel and big fluctuations in Accessories and gear
| Year | Footwear | Apparel | Accessories and gear |
|---|---|---|---|
| 2023 | 12.139 Billion | 7.806 Billion | 1.483 Billion |
| 2022 | 12.287 Billion | 8.731 Billion | 1.493 Billion |
| 2021 | 11.336 Billion | 8.71 Billion | 1.187 Billion |
| 2020 | 10.129 Billion | 7.315 Billion | 991 Million |
| 2019 | 13.521 Billion | 8.963 Billion | 1.156 Billion |
| 2018 | 12.783 Billion | 8.223 Billion | 910 Mllion |
| 2017 | 12.427 Billion | 7.747 Billion | 1.044 Billion |
| 2016 | 10.132 Billion | 7.352 Billion | 999 Million |
| 2015 | 8.360 Billion | 6.97 Billion | 1.585 Billion |
| 2014 | 6.658 Billion | 6.279 Billion | 1.597 Billion |
| 2013 | 6.587 Billion | 5.811 Billion | 1.806 Billion |
| 2012 | 6.922 Billion | 6.290 Billion | 1.671 Billion |
| 2011 | 6.242 Billion | 5.733 Billion | 1.347 Billion |
| 2010 | 5.389 Billion | 5.380 Billion | 1.221 Billion |
| 2009 | 4.642 Billion | 4.663 Billion | 1.076 Billion |
| 2008 | 4.919 Billion | 4.775 Billion | 910 Million |
Source: Adidas 10 Year Overview(2023 and 2017)
Adidas Profit
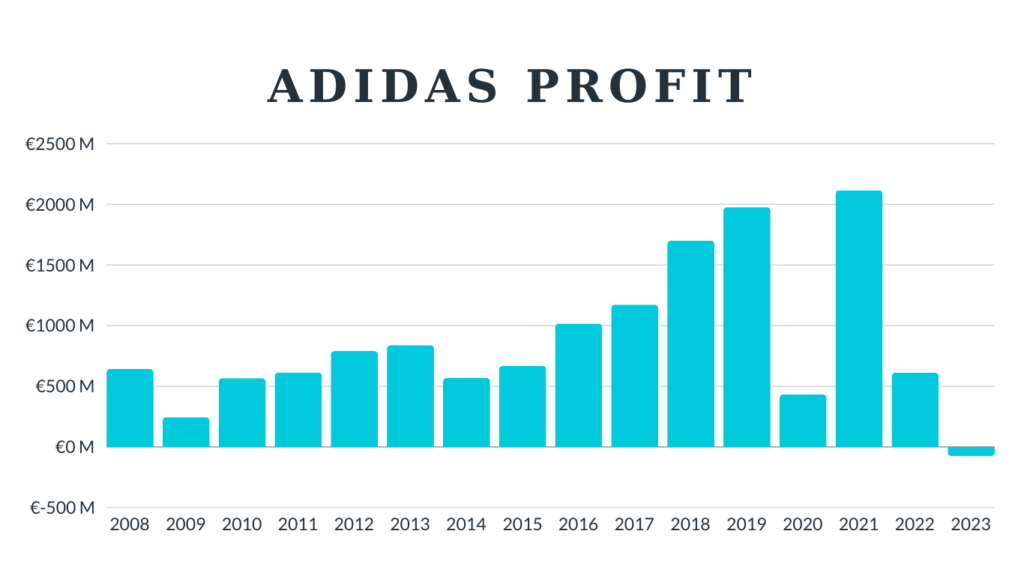
In 2023, Adidas faced a challenging year, recording a loss of €75 million. This marks the company’s first loss in 30 years. However, Adidas has experienced profitable years in the past, with a notable profit of €2.116 billion in 2021. Since 2009, when the profit was €245 million, there has been an overall upward trend in profitability, peaking in 2021 with a 764% increase.
These values represents the final profit or loss of the company after all expenses, including taxes and interest, have been deducted from the company’s revenue.
| Year | Profit |
|---|---|
| 2023 | -€75 Million |
| 2022 | €612 Million |
| 2021 | €2.116 Billion |
| 2020 | €432 Million |
| 2019 | €1.976 Billion |
| 2018 | €1.702 Billion |
| 2017 | €1.173 Billion |
| 2016 | €1.017 Billion |
| 2015 | €668 Million |
| 2014 | €568 Million |
| 2013 | €839 Million |
| 2012 | €791 Million |
| 2011 | €613 Million |
| 2010 | €567 Million |
| 2009 | €245 Million |
| 2008 | €642 Million |
Source: Adidas 10 Year Overview(2023 and 2017)
Adidas Gross Profit
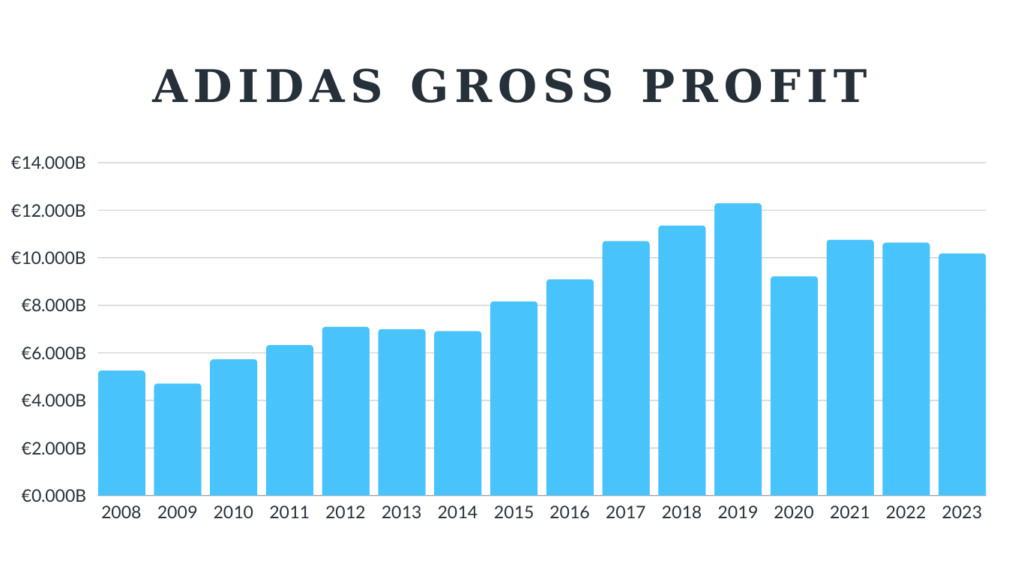
In 2023, Adidas achieved a gross profit of €10.184 billion, a 94% increase from €5.256 billion in 2008 but a 4.32% decrease compared to the previous year. The highest gross profit was recorded in 2019 at €12.293 billion, demonstrating the company’s ability to maintain substantial profitability margins over the years.
| Year | Gross Profit |
|---|---|
| 2023 | €10.184 Billion |
| 2022 | €10.644 Billion |
| 2021 | €10.765 Billion |
| 2020 | €9.222 Billion |
| 2019 | €12.293 Billion |
| 2018 | €11.363 Billion |
| 2017 | €10.703 Billion |
| 2016 | €9.100 Billion |
| 2015 | €8.168 Billion |
| 2014 | €6.924 Billion |
| 2013 | €7.001 Billion |
| 2012 | €7.103 Billion |
| 2011 | €6.329 Billion |
| 2010 | €5.730 Billion |
| 2009 | €4.712 Billion |
| 2008 | €5.256 Billion |
Source: Adidas 10 Year Overview(2023 and 2017)
Adidas And Nike Brand Value
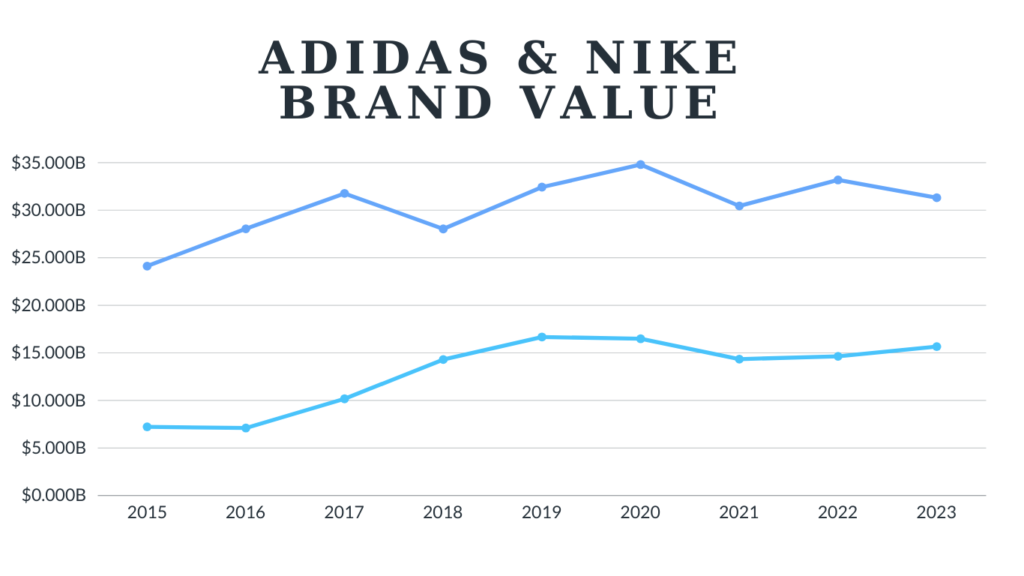
In 2023, Adidas’ brand value stood at $15.660 billion, a 117% increase from $7.224 billion in 2015, while Nike only had 30% increase since 2015. Even with Adidas having faster growth Nike still has almost double the brand value of Adidas in 2023.
| Year | Adidas | Nike |
|---|---|---|
| 2023 | $15.660B | $31.307B |
| 2022 | $14.636B | $33.176B |
| 2021 | $14.342B | $30.443B |
| 2020 | $16.481B | $34.792B |
| 2019 | $16.669B | $32.421B |
| 2018 | $14.295B | $28.030B |
| 2017 | $10.169B | $31.762B |
| 2016 | $7.098B | $28.041B |
| 2015 | $7.224B | $24.118B |
Source: Brandirectory
Number of Adidas retail stores by store type
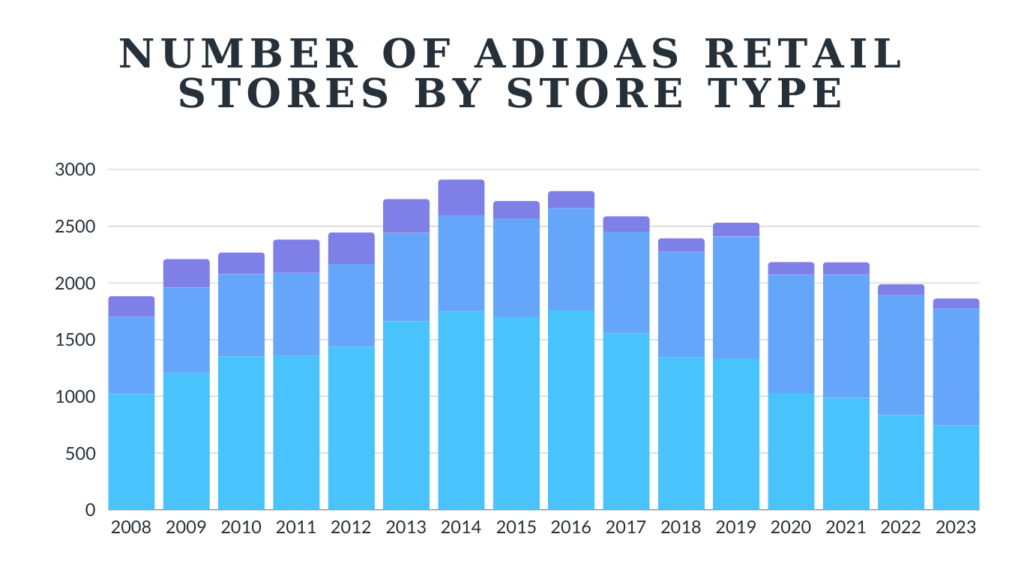
By 2023, Adidas operated a total of 1,863 stores worldwide, comprising 744 concept stores, 1,031 factory outlets, and 88 concession stores. This represents a significant decrease from the peak in 2014 with 2,913 stores, showing a 36% reduction in the total number of stores over nine years.
| Year | Concept Stores | Factory Outlet | Concession Stores and other | Total |
|---|---|---|---|---|
| 2023 | 744 Stores | 1,031 Outlets | 88 Stores | 1,863 |
| 2022 | 834 Stores | 1,057 Outlets | 99 Stores | 1,990 |
| 2021 | 987 Stores | 1,086 Outlets | 111 Stores | 2,184 |
| 2020 | 1,029 Stores | 1,044 Outlets | 112 Stores | 2,185 |
| 2019 | 1,333 Stores | 1,075 Outlets | 125 Stores | 2,533 |
| 2018 | 1,342 Stores | 933 Outlets | 120 Stores | 2,395 |
| 2017 | 1,557 Stores | 895 Outlets | 136 Stores | 2,588 |
| 2016 | 1,757 Stores | 902 Outlets | 152 Stores | 2,811 |
| 2015 | 1,698 Stores | 872 Outlets | 152 Stores | 2,722 |
| 2014 | 1,746 Stores | 851 Outlets | 316 Stores | 2,913 |
| 2013 | 1,661 Stores | 779 Outlets | 300 Stores | 2,740 |
| 2012 | 1,437 Stores | 730 Outlets | 279 Stores | 2,446 |
| 2011 | 1,355 Stores | 734 Outlets | 295 Stores | 2,384 |
| 2010 | 1,352 Stores | 725 Outlets | 193 Stores | 2,270 |
| 2009 | 1,203 Stores | 755 Outlets | 254 Stores | 2,212 |
| 2008 | 1,019 Stores | 681 Outlets | 184 Stores | 1,884 |
Source: Statista
Adidas Revenue By Channel in %
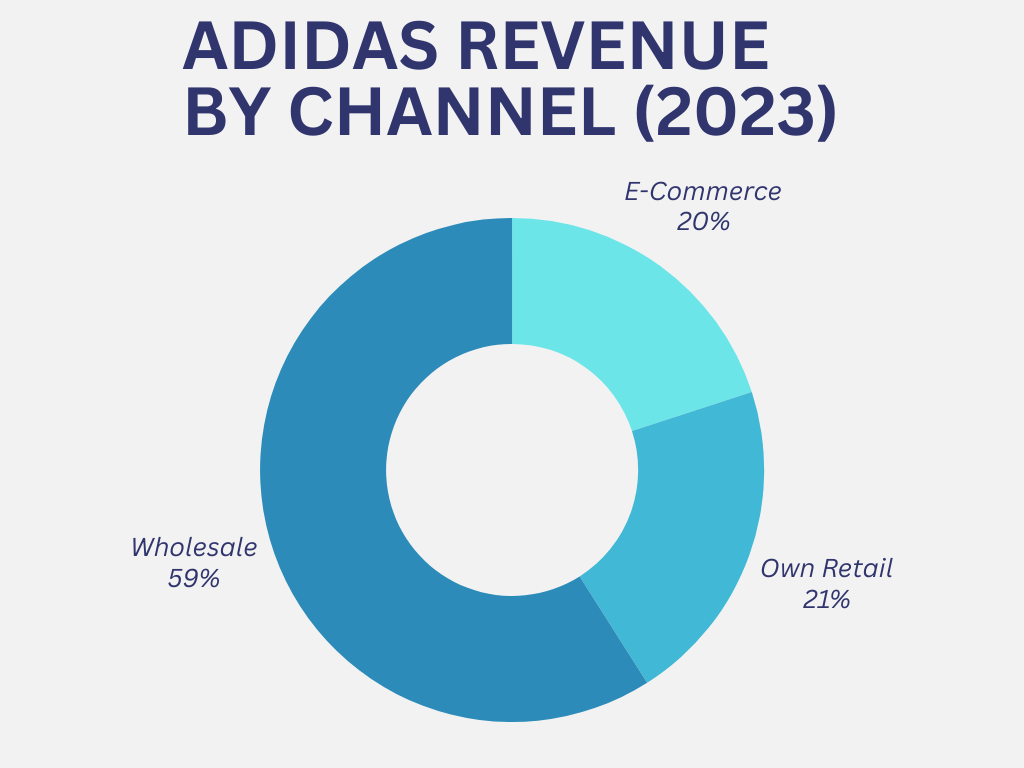
In 2023, wholesale channels generated 59% of Adidas’ revenue, followed by e-commerce at 20% and own retail at 21%. These figures illustrate the diversified revenue streams Adidas utilizes to reach its customers and how important Wholesale is to Adidas.
| Year | E-Commerce | Own Retail | Wholesale |
|---|---|---|---|
| 2023 | 20% | 21% | 59% |
| 2022 | 20% | 19% | 61% |
| 2021 | 19% | 19% | 62% |
| 2020 | 21% | 20% | 59% |
Source: Adidas Annual Report
Amount of Adidas employees
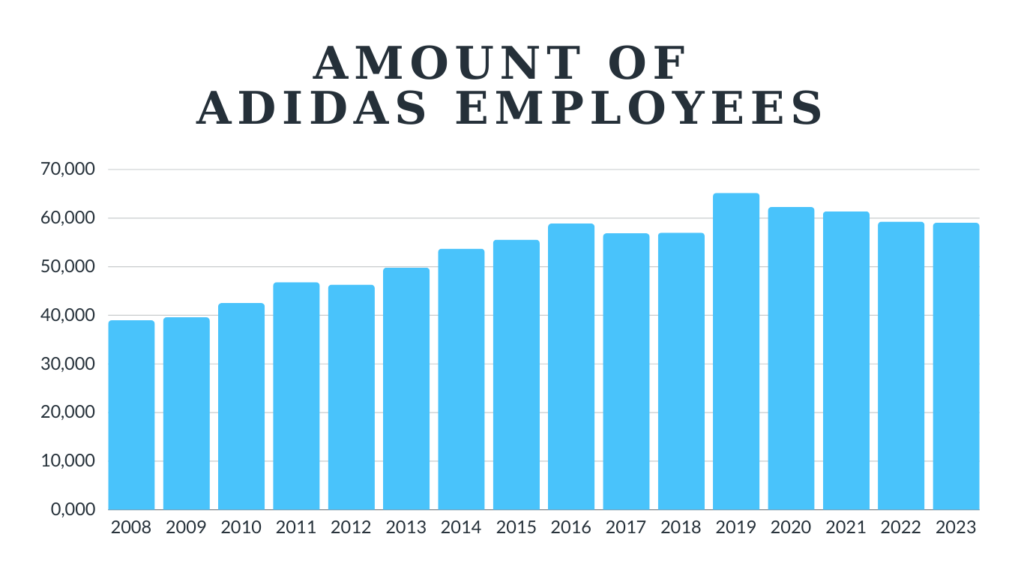
As of 2023, Adidas employed 59,030 people globally, a 51.4% increase from 38,982 employees in 2008. This growth shows the company’s expansion and operational scaling over the years.
| Year | Employees |
|---|---|
| 2023 | 59,030 |
| 2022 | 59,258 |
| 2021 | 61,401 |
| 2020 | 62,285 |
| 2019 | 65,194 |
| 2018 | 57,016 |
| 2017 | 56,888 |
| 2016 | 58,902 |
| 2015 | 55,555 |
| 2014 | 53,731 |
| 2013 | 49,808 |
| 2012 | 46,306 |
| 2011 | 46,824 |
| 2010 | 42,541 |
| 2009 | 39,596 |
| 2008 | 38,982 |
Source: Adidas 10 Year Overview(2023 and 2017)
Employee expenses
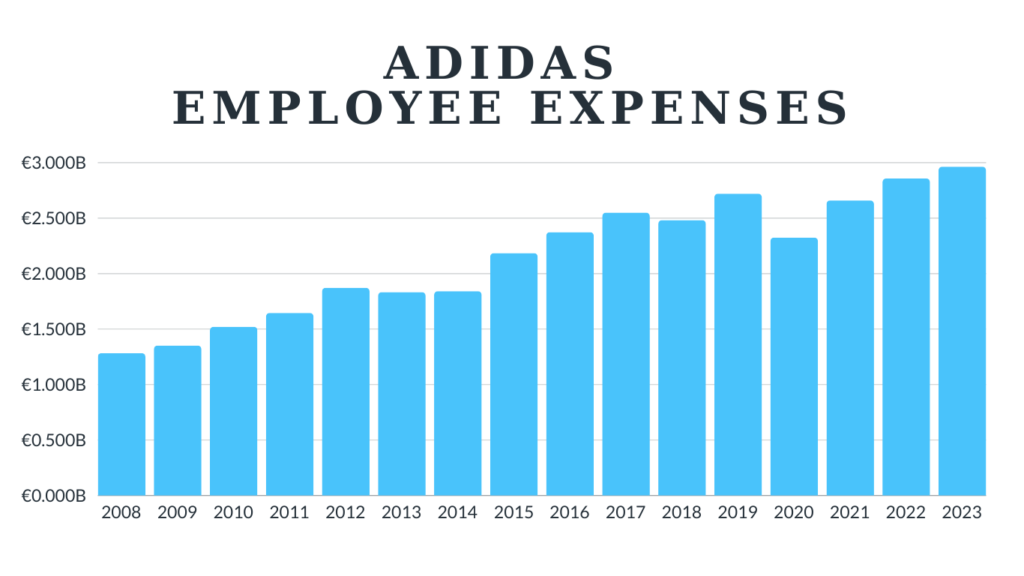
In 2023, Adidas’ personnel expenses amounted to €2.964 billion, marking a 131% increase from €1.283 billion in 2008.
| Year | Personnel Expenses |
|---|---|
| 2023 | €2.964 Billion |
| 2022 | €2.856 Billion |
| 2021 | €2.659 Billion |
| 2020 | €2.325 Billion |
| 2019 | €2.720 Billion |
| 2018 | €2.481 Billion |
| 2017 | €2.549 Billion |
| 2016 | €2.373 Billion |
| 2015 | €2.184 Billion |
| 2014 | €1.842 Billion |
| 2013 | €1.833 Billion |
| 2012 | €1.872 Billion |
| 2011 | €1.646 Billion |
| 2010 | €1.521 Billion |
| 2009 | €1.352 Billion |
| 2008 | €1.283 Billion |
Source: Adidas 10 Year Overview(2023 and 2017)
Average Salary Per Employee
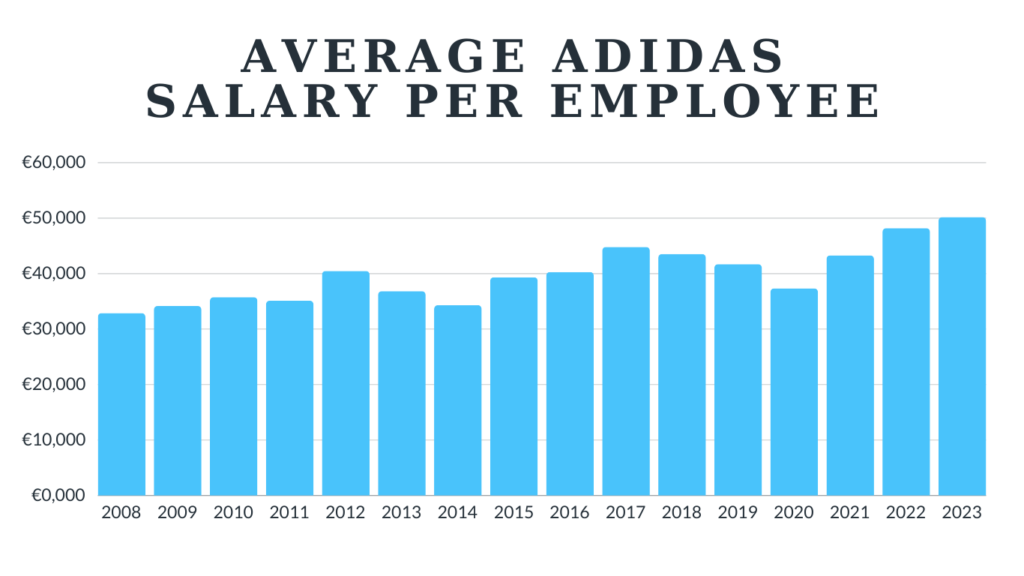
In 2023, the average salary per Adidas employee was approximately €50,165. This represents a 53% increase from €32,866 in 2008.
I calculated this based on the personnel expenses divided by the number of employees at year-end, using the data provided in previous tables.
| Year | Average Salary Per Employee (€) |
|---|---|
| 2023 | €50,165 |
| 2022 | €48,173 |
| 2021 | €43,289 |
| 2020 | €37,337 |
| 2019 | €41,707 |
| 2018 | €43,532 |
| 2017 | €44,798 |
| 2016 | €40,270 |
| 2015 | €39,341 |
| 2014 | €34,307 |
| 2013 | €36,827 |
| 2012 | €40,471 |
| 2011 | €35,115 |
| 2010 | €35,747 |
| 2009 | €34,157 |
| 2008 | €32,866 |
All Graphs In Dowloadable Images
You can use any of these images as long as you give credit 👍.
