

Uniqlo was founded in 1984 and is part of a company called Fast Retailing. Uniqlo has grown from a Japanese textiles manufacturer into a leading global fashion retailer known for its affordable, high-quality quality and innovative clothes.
Since 1984, they have grown from a single store in Hiroshima to 2434 stores across the entire world as of 2023.
The conversion rate for yen to USD was 0.0068 as of the writing of this article.
From annual revenue and profits to global store count, here’s a breakdown of everything you’ll find out about on this page:
Table of Contents
Key Uniqlo Stats
- UNIQLO achieved a 16.6% profit margin in 2024, up from 14.8% in 2023.
- Founded in 1984, UNIQLO has grown from a single store to 2,434 stores globally by 2023.
- International operating revenue saw a 2,648.57% increase from $70 million in 2012 to $1,924 million in 2024.
- Heattech sales exceeded 1.5 billion units by 2022.
- International revenue experienced a 1,031% increase from 2012 to 2024, from $1.04 billion to $11.61 billion.
Uniqlo Annual Revenue
In 2024, Uniqlo earned $17.94 billion in annual revenue, marking an increase of 13.3% compared to 2023.
| Year | Annual Revenue |
|---|---|
| 2012 | $5.26 billion |
| 2013 | $6.35 billion |
| 2014 | $7.68 billion |
| 2015 | $9.41 billion |
| 2016 | $9.90 billion |
| 2017 | $10.33 billion |
| 2018 | $11.97 billion |
| 2019 | $12.9 billion |
| 2020 | $11.22 billion |
| 2021 | $12.1 billion |
| 2022 | $13.12 billion |
| 2023 | $15.83 billion |
| 2024 | $17.94 billion |
Sources: Fastretailing(Uniqlo Parent company)
Uniqlo Annual Revenue by Region
From 2012 to 2024, UNIQLO International’s Revenue had the biggest growth, increasing from $1.04 billion to $11.76 billion, a 1,031% increase.
| Year | UNIQLO Japan Revenue | UNIQLO International Revenue | Greater China Revenue |
|---|---|---|---|
| 2012 | $4.22 billion | $1.04 billion | Not listed |
| 2013 | $4.65 billion | $1.71 billion | $0.85 billion |
| 2014 | $4.87 billion | $2.81 billion | $1.42 billion |
| 2015 | $5.30 billion | $4.10 billion | $2.07 billion |
| 2016 | $5.44 billion | $4.46 billion | $2.26 billion |
| 2017 | $5.51 billion | $4.82 billion | $2.31 billion |
| 2018 | $5.88 billion | $6.09 billion | $2.99 billion |
| 2019 | $5.94 billion | $6.98 billion | $3.40 billion |
| 2020 | $5.49 billion | $5.74 billion | $3.10 billion |
| 2021 | $5.7 billion | $6.29 billion | $3.60 billion |
| 2022 | $6.23 billion | $6.89 billion | $4.15 billion |
| 2023 | $6.05 billion | $9.77 billion | $4.22 billion |
| 2024 | $6.32 billion | $11.61 billion | $4.59 billion |
Fast Retailing didn’t start reporting Uniqlo’s revenue from Southeast Asia, India, Australia, North America, and Europe until 2017.
| Year | Southeast Asia, India & Australia Revenue | North America Revenue | Europe Revenue |
|---|---|---|---|
| 2017 | $750 million | $480 million | $410 million |
| 2018 | $950 million | $610 million | $610 million |
| 2019 | $1.16 billion | $680 million | $680 million |
| 2020 | Not listed | Not listed | Not listed |
| 2021 | $1.02 billion | $544 million | $748 million |
| 2022 | $2.31 billion | $850 million | $1.23 billion |
| 2023 | $3.05 billion | $1.11 billion | $1.31 billion |
| 2024 | $3.67 billion | $1.48 billion | $1.87 billion |
Sources: Fastretailing
Uniqlo Operating Revenue
From 2012 to 2024, Uniqlo’s operating revenue grew from $770 million to $2.98 billion, representing a 287% increase over the 12-year period.
For the year 2024, Uniqlo achieved a profit margin of 16.6%.
| Year | Operating Revenue |
|---|---|
| 2012 | $0.7700B |
| 2013 | $0.7800B |
| 2014 | $0.9900B |
| 2015 | $1.0900B |
| 2016 | $0.9500B |
| 2017 | $1.1500B |
| 2018 | $1.6200B |
| 2019 | $1.6400B |
| 2020 | $1.0500B |
| 2021 | $1.5939B |
| 2022 | $1.9200B |
| 2023 | $2.3440B |
| 2024 | $2.98B |
Uniqlo Operating Revenue By Region
Uniqlo International’s operating revenue has had insane growth of 2104.29% going from $70.0 million in 2012 to $1543.0 million in 2023.
| Year | Operating Revenue Japan | Operating Revenue International |
|---|---|---|
| 2012 | $700.0M | $70.0M |
| 2013 | $660.0M | $120.0M |
| 2014 | $750.0M | $240.0M |
| 2015 | $800.0M | $290.0M |
| 2016 | $700.0M | $250.0M |
| 2017 | $650.0M | $500.0M |
| 2018 | $810.0M | $810.0M |
| 2019 | $700.0M | $940.0M |
| 2020 | $710.0M | $340.0M |
| 2021 | $837.8M | $756.2M |
| 2022 | $843.0M | $1.076B |
| 2023 | $801.0M | $1.543B |
| 2024 | $1.058B | $1.924B |
Number of Stores Worldwide
From 1997 to 2023, the number of UNIQLO stores worldwide expanded dramatically, growing from 276 to 2.434 stores, showing significant growth since opening their first store in 1984.
| Year | Total Stores |
|---|---|
| 1997 | 276 |
| 1998 | 336 |
| 1999 | 368 |
| 2000 | 433 |
| 2001 | 519 |
| 2002 | 585 |
| 2003 | 621 |
| 2004 | 646 |
| 2005 | 693 |
| 2006 | 750 |
| 2007 | 787 |
| 2008 | 813 |
| 2009 | 862 |
| 2010 | 944 |
| 2011 | 1024 |
| 2012 | 1137 |
| 2013 | 1299 |
| 2014 | 1485 |
| 2015 | 1639 |
| 2016 | 1795 |
| 2017 | 1920 |
| 2018 | 2068 |
| 2019 | 2196 |
| 2020 | 2252 |
| 2021 | 2312 |
| 2022 | 2394 |
| 2023 | 2434 |
Number of Stores By Region
Uniqlo started to have a bigger focus on countries outside of Japan, as you can see by the number of stores in Japan decreasing from 853 at their highest point down to 800 stores, while stores in China skyrocketed from 178 to 1031 stores.
| Year | Japan | Greater China | South Korea | SOUTH ASIA, SOUTHEAST ASIA & OCEANIA | North America | Europe |
|---|---|---|---|---|---|---|
| 2012 | 845 | 178 | 80 | 17 | 3 | 14 |
| 2013 | 853 | 280 | 105 | 39 | 7 | 15 |
| 2014 | 852 | 374 | 133 | 80 | 25 | 21 |
| 2015 | 841 | 467 | 155 | 108 | 42 | 26 |
| 2016 | 837 | 560 | 173 | 144 | 45 | 36 |
| 2017 | 831 | 645 | 179 | 163 | 46 | 56 |
| 2018 | 827 | 726 | 186 | 198 | 53 | 78 |
| 2019 | 817 | 807 | 188 | 231 | 62 | 91 |
| 2020 | 813 | 866 | 163 | 248 | 62 | 100 |
| 2021 | 810 | 932 | 134 | 270 | 57 | 109 |
| 2022 | 809 | 996 | 122 | 293 | 59 | 115 |
| 2023 | 800 | 1031 | 126 | 342 | 67 | 68 |
Uniqlo Heattech Sales
The Uniqlo Heattech came out in 2003 and has sold over 1.5 billion units as of 2022.
Uniqlo Non-Financial Highlights
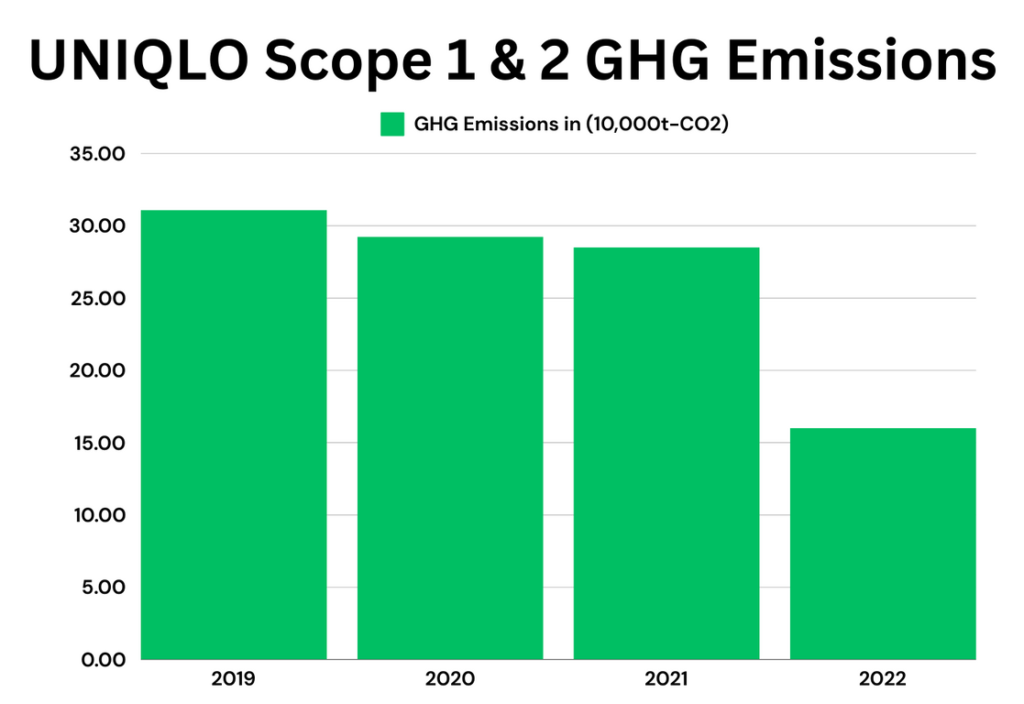
Scope 1 & 2 GHG Emissions
UNIQLO aims to reduce its GHG emissions by 90% by 2030 from 2019 levels. They have achieved a 45.7% reduction as of 2022, with emissions dropping from 310.090t to 160.000t CO2. This shows they are actually committed to their goals.
| Year | Scope 1 & 2 GHG Emissions (10,000t-CO2) |
|---|---|
| 2019 | 31.09 |
| 2020 | 29.23 |
| 2021 | 28.5 |
| 2022 | 16 |
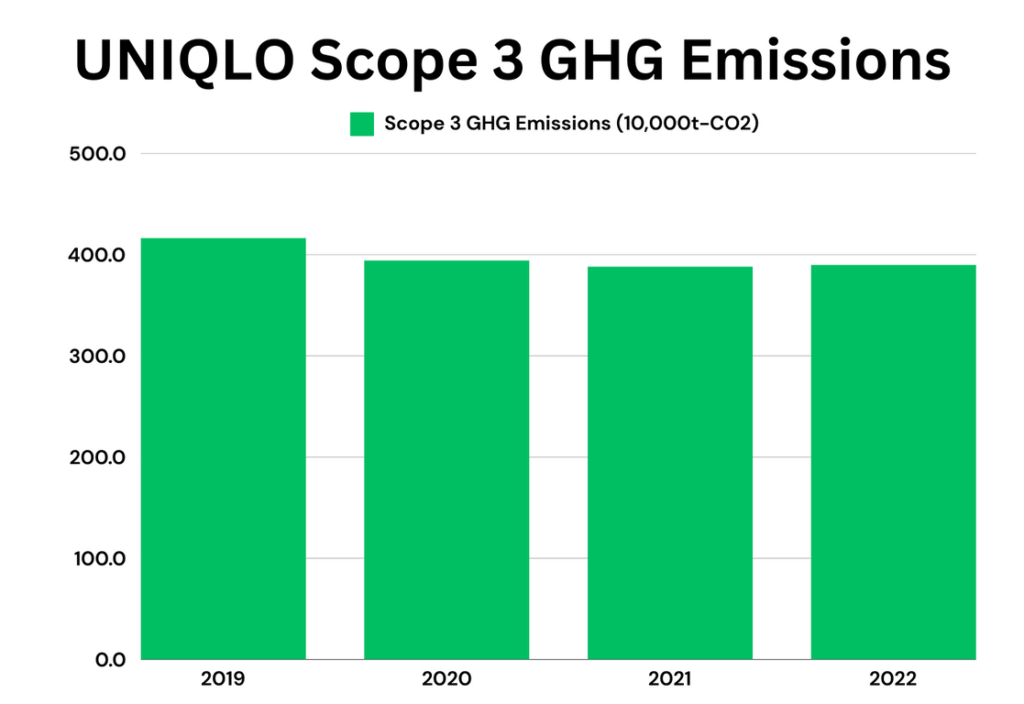
Scope 3 GHG Emissions
UNIQLO aims for a 20% reduction in Scope 3 GHG Emissions, which is related to raw materials, fabrics, and product sewing, by 2030 based on 2019 levels.
Despite a slight increase to 3.9 million tons of CO2 in 2022 due to heightened production, ongoing efforts, including equipment upgrades at partner factories, are still expected to drive future declines in emissions.
| Year | Scope 3 GHG Emissions (10,000t-CO2) |
|---|---|
| 2019 | 416.6 |
| 2020 | 394.4 |
| 2021 | 388.4 |
| 2022 | 390 |
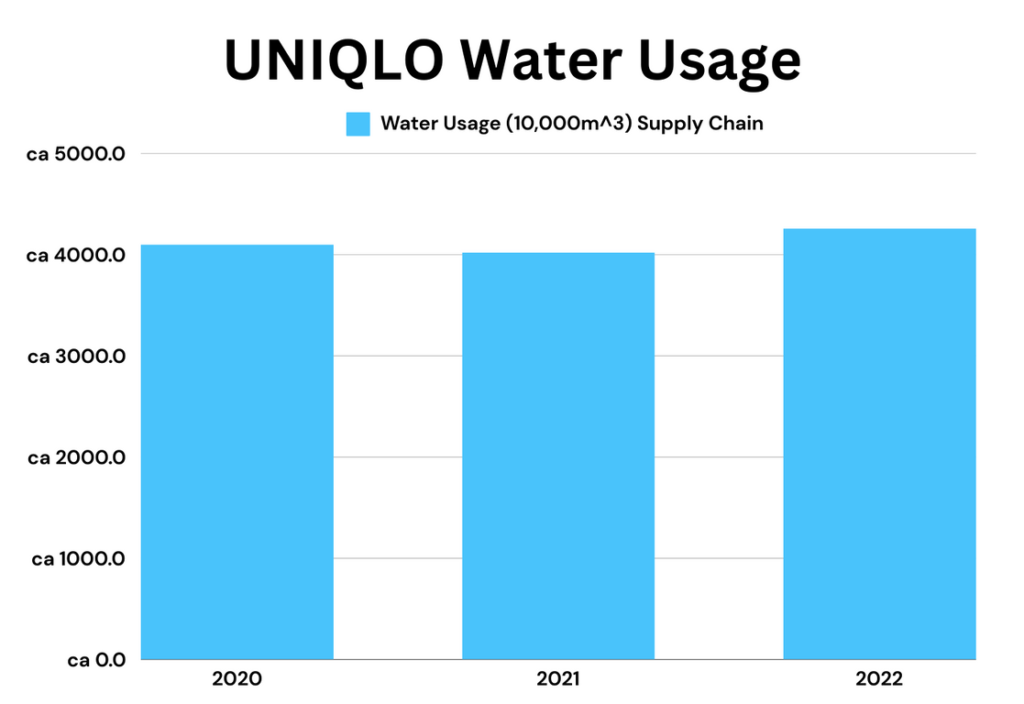
Water Usage
UNIQLO is actively working to reduce water usage in its supply chain, particularly in high-risk areas, aiming for a 10% reduction per unit by 2025 from the 2020 baseline.
Despite this goal, water usage increased from 41 million cubic meters in 2020 to 42.6 million cubic meters in 2022.
| Year | Water Usage (10,000m^3) Supply Chain |
|---|---|
| 2020 | 4100 |
| 2021 | 4021.6 |
| 2022 | 4260 |